Volume Analysis | Flash Update – 4.14.25
Reshuffling the Deck
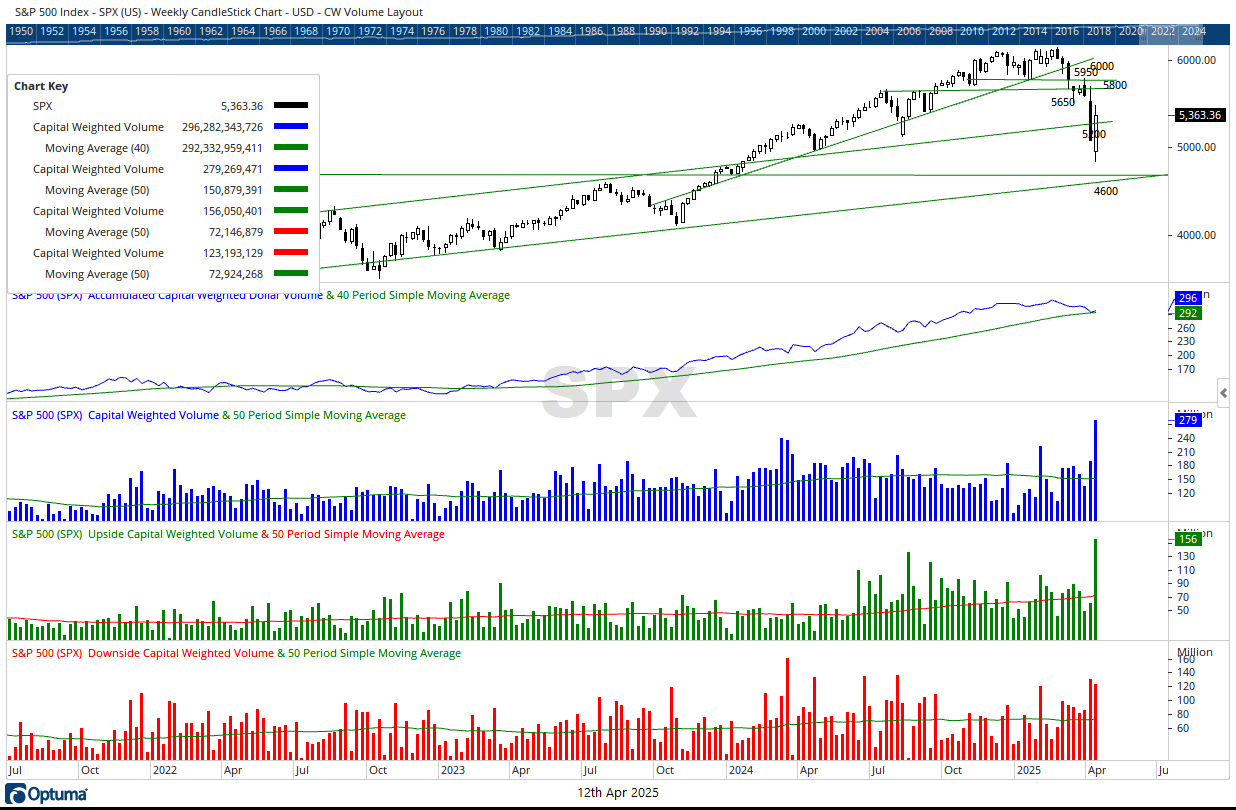
Like a high-stakes battlefield shuffled anew, this week’s market action unfolded with historic magnitude. Capital Weighted Volume, Capital Flows (Capital Weighted Dollar Volume), Upside CW Volume, and Dollar Volume all surged to all-time weekly highs—marking what could be a pivotal realignment in investor positioning.
The week began in disarray. On Tuesday, nearly 99% of Capital Weighted Volume and Dollar Volume was to the downside—an overwhelming retreat. Yet just as it seemed the last soldier on Bullish Island had fallen, Wednesday, April 9th, delivered a counteroffensive of epic proportions. In perhaps one of the most dramatic reversals in modern market history, $120 billion of capital (single day CW $ Volume record) stormed into the S&P 500, while a paltry $220million exited. With 7 million shares (single day upside CW Volume record) charging uphill versus just 500K in retreat, both CW Volume and CW Dollar Volume posted nearly mythical 99.99% upside days. For the week, $430 billion traded hands—$230 billion in capital weighed S&P 500 inflows, a record, and $200 billion in outflows, a near-record itself. A violent churn of capital that, while alarming in isolation, may point to a more profound reshuffling beneath the surface.
Just like Christie’s stranded island guests, positions are vanishing—only to be replaced by new players taking their place at the table. Some investors clearly fled the battlefield, perhaps wounded from recent losses. But even more capital surged back in, suggesting a recalibration rather than a rout. Portfolios are rotating. Long and short positions are slipping from their former homes into new battalions. Throughout the recent decline, new leadership by the brass commanders has been suggesting new themes, possibly signaling a long-term shift in the market narrative. But yet in this transformational reversal from retreat to rally saw many of the fallen Nephilim reborn.
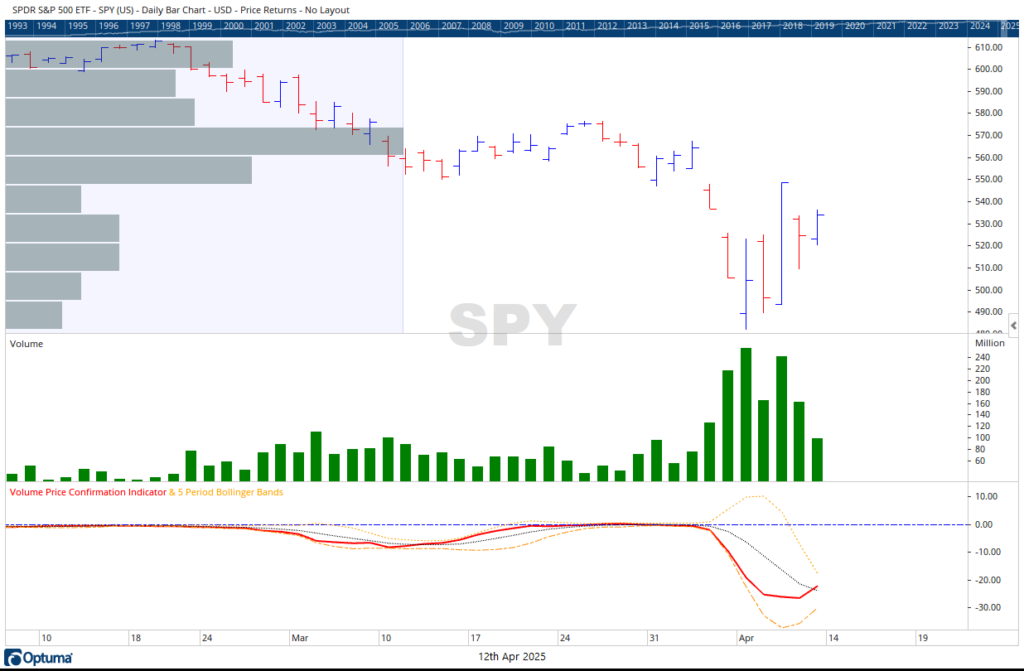
The S&P 500 rallied 5.70% for the week, advancing behind rising upside volume. Our key reconnaissance indicators—Capital Weighted Volume and Dollar Volume—both executed a fishhook reversal, turning sharply up after steep descents. Though still under their longer-term trendlines, they now approach their moving average resistance with surprising force, a prospect that seemed almost laughable just a week ago.
Meanwhile, the VIX spiked above 50 for several days, sentiment gauges tilted historically bearish, credit spreads widened, and a steep VPCI V-bottom setup dropped deeply – all signals suggesting pontifical capitulation occurring midweek. This is often how bottoms are born: not with a fading whisper, but rather with a load bang.
As the fog lifted, the Generals, Invesco QQQ Trust (QQQ), charged ahead, gaining 7.35%, followed closely by their lieutenants, SPDR S&P 500 ETF (SPY) up 5.67%. Yet well behind, the Troops, iShares Russell 2000 (IWM), gained only 1.73%, and the Brass Commanders. Schwab US Dividend Equity ETF (SCHD), barely advanced at all, up just 0.08% – offering little support from these income and quality defensive forces. If this rally is to hold ground and expand its perimeter, the commanding officers expect the full cooperation of all their units. Otherwise, the front-line risks becoming stretched and vulnerable to another ambush.
Historic Charge… or a bear trap? Wednesday’s 9.51% one-day leap in the S&P 500 was the third-largest on record, behind only October 13th (11.58%) and 28th (10.79%) of 2008. Such context may put a damper to the bullish optimism so let’s look at another example of big one day upside moves. The Dow has a longer history than the S&P 500. It also joined the assault, surging 7.87%, and its historical precedence paints a more nuanced picture. The Dow’s follow-through after 7%+ up days for those with shorter term outlooks of three and six months has often been erratic, but for long-term investors of a year or more, these dramatic up days have more often than not signaled a turning tide. Yet, the context may matter. In 2008, large bounces occurred within a broader downtrend. This rally, while impressive, must still prove it can break through entrenched resistance before being declared fully victorious.
We continue to monitor the VPCI VW bottom formation—but this is no ordinary V or W. Historically, a VPCI W stems from two shallow V-bottoms. This potential pattern appears to be forming two deep VPCI V bottoms—a rare phenomenon not seen even in the chaos of 2008.
Overall, volume and capital flows have made tremendous strides toward recovery, yet the war is far from won. The S&P 500 now finds solid support footing at 4800, but major resistance lies between 5600 and 5650. Until those fortifications are breached, we remain entrenched in a wide-range no-man’s-land sideways market. But for bulls, that’s a big improvement from last weeks state. As always, tactical risk management is the soldier’s shield and the investor’s defensive fortress. Here’s to you keeping your wits sharp, your positions agile, and your discipline unwavering.
Grace and peace my friends,
BUFF DORMEIER, CMT


Updated: 4/14/2025. Historical references do not assume that any prior market behavior will be duplicated. Past performance does not indicate future results. This material has been prepared by Kingsview Wealth Management, LLC. It is not, and should not, be regarded as investment advice or as a recommendation regarding any particular security or course of action. Opinions expressed herein are current opinions as of the date appearing in this material only. All investments entail risks. There is no guarantee that investment strategies will achieve the desired results under all market conditions and each investor should evaluate their ability to invest for the long term. Investment advisory services offered through Kingsview Wealth Management, LLC (“KWM”), an SEC Registered Investment Adviser.